BMF Tools
Module Manager
module_manager is a tool for managing modules, providing the following capabilities:
- Module list: You can get the list of locally installed modules through
module_manager list, including built-in modules and modules developed by yourself; - Module details: For each module, module details can be obtained through
module_manager dump ${module_name}, such as module name, module type, module entry, module description information, module definition tag and module installation path; - Module installation and uninstallation: For custom modules, they can be installed to the module path of BMF, so that they can be used in graph more conveniently. Modules can also be unloaded when they are no longer needed.
The specific usage can be viewed through
module_manager help. Please note: The module_manager tool needs to rely on the BMF underlying library, so you need to set the corresponding environment variables. For specific steps, please refer to BMF Installation.
Trace tool
The main function of Trace is to record some important events for troubleshooting or analysis. Trace logs relevant information at runtime, and then writes tracelog logs at the end.
Start Trace
Trace tool can be started via environment variable:
$ export BMF_TRACE=ENABLE
By default, various Trace types are provided in the engine. Enabling Trace allows these events to be logged at runtime.
To provide users with a lower level of control to minimize unnecessary collection of trace events, users can choose to enable only selected Trace-types (comma-separated):
$ export BMF_TRACE=PROCESSING,SCHEDULE
Disable Trace
Trace is disabled by default. However, if an environment variable for trace enable has been previously set, it can be disabled:
$ unset BMF_TRACE
Trace analysis
The tool will print and generate tracelog logs after execution. Users can refer to the information collected by Trace in different ways.
1. Console print
When using the Trace tool, after the graph is executed, some information about the Trace will be printed out:
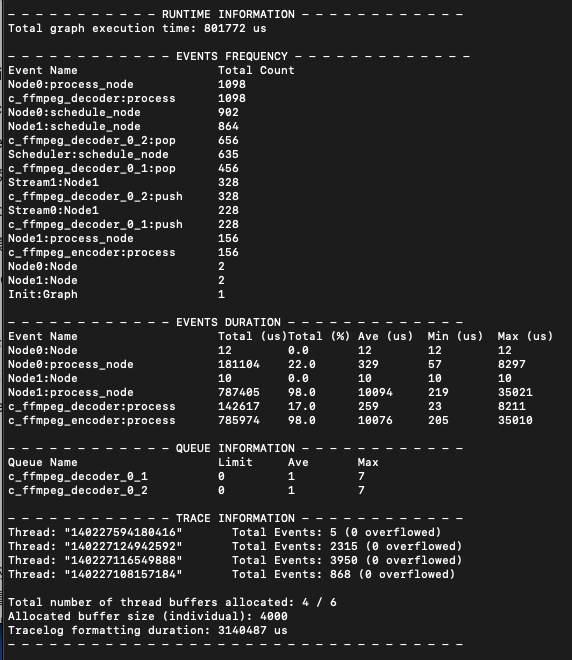
The printed information includes:
- Runtime Information Graph total execution time. If the BMF_TRACE_INIT interface is used, it also displays the time from BMF_TRACE_INIT to the completion of graph execution. These times do not include tracelog generation time.
- Events Frequency The number of occurrences of each Trace event (in descending order).
- Events Duration
The execution time of each duration event:
- Total: Total
- Total (%): The percentage of the total execution time of the operation
- Ave: Average
- Min, Max: minimum and maximum values
- Queue Information
Stream’s queue information:
- Limit: the upper limit of the queue size (or zero if infinite)
- Ave: Average number of items in the queue
- Max: Maximum number of items in the queue
- Throughput Average input packets processed in 1 second
- Trace Information Some information about the Trace tool, such as the total number of Trace events per thread, how many events overflowed due to insufficient buffer, logging time, and so on.
By default, Trace information will print Trace information to the console at the end of graph execution. However, this will result in increased processing time until the end of code execution. Printing can be disabled if desired:
# Default is ENABLE
$ export BMF_TRACE_PRINTING=DISABLE
2. Chrome Tracing
The Tracelog JSON log format conforms to the format used in Chrome Tracing (Chrome web browser - chrome://tracing/ ), so it can be visualized using Chrome Tracing:
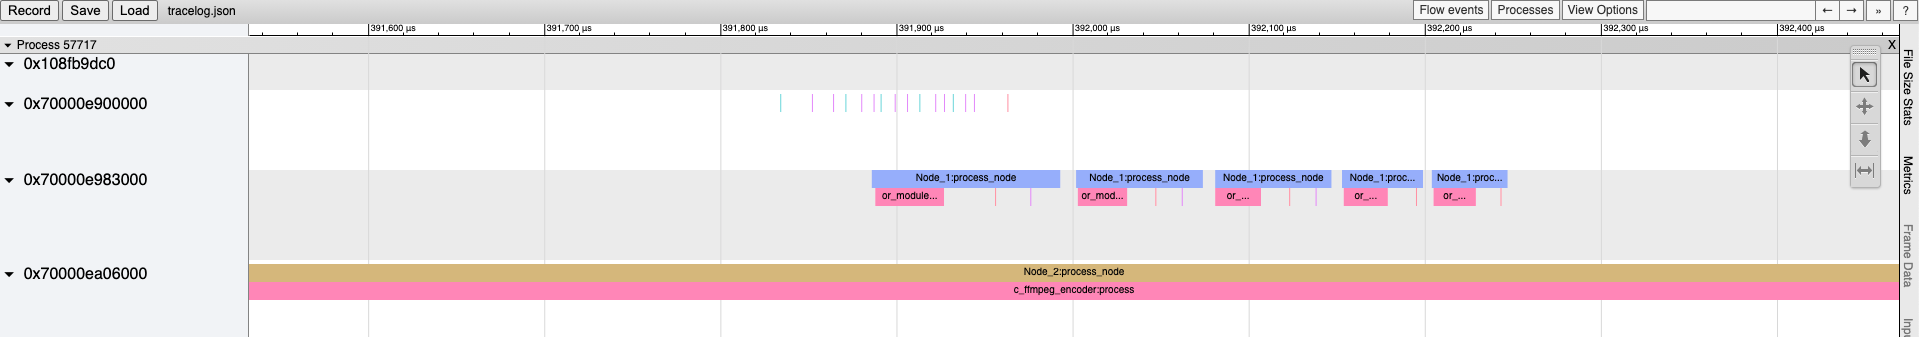
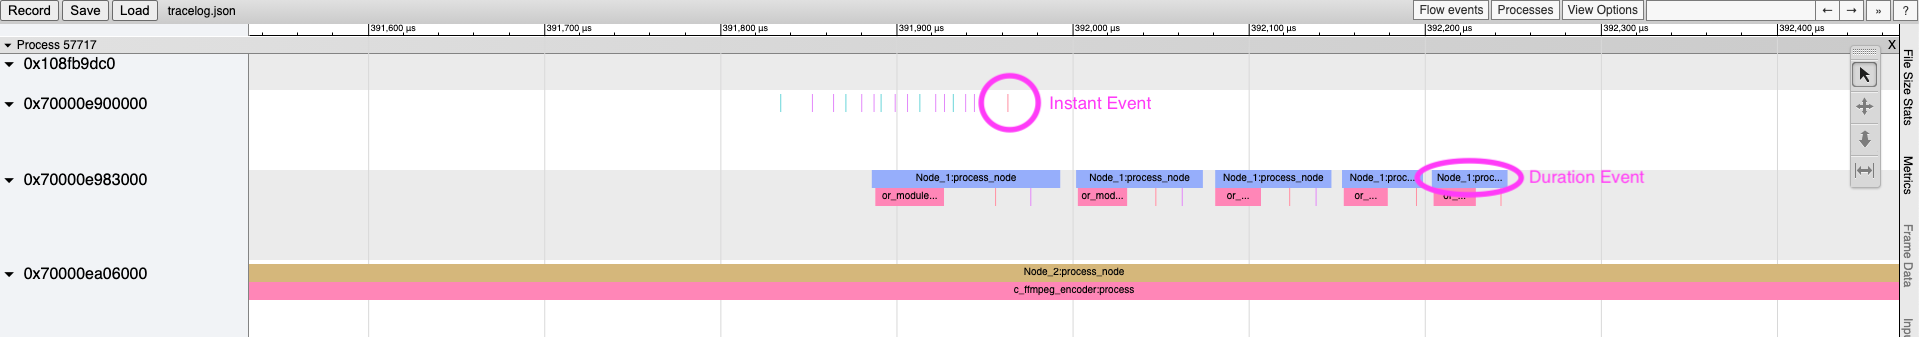
The representations of Instant events and duration events are easily distinguished:
At the end of the recording, Trace will append relevant information (Trace info) to the end of the log to indicate that the log is complete:
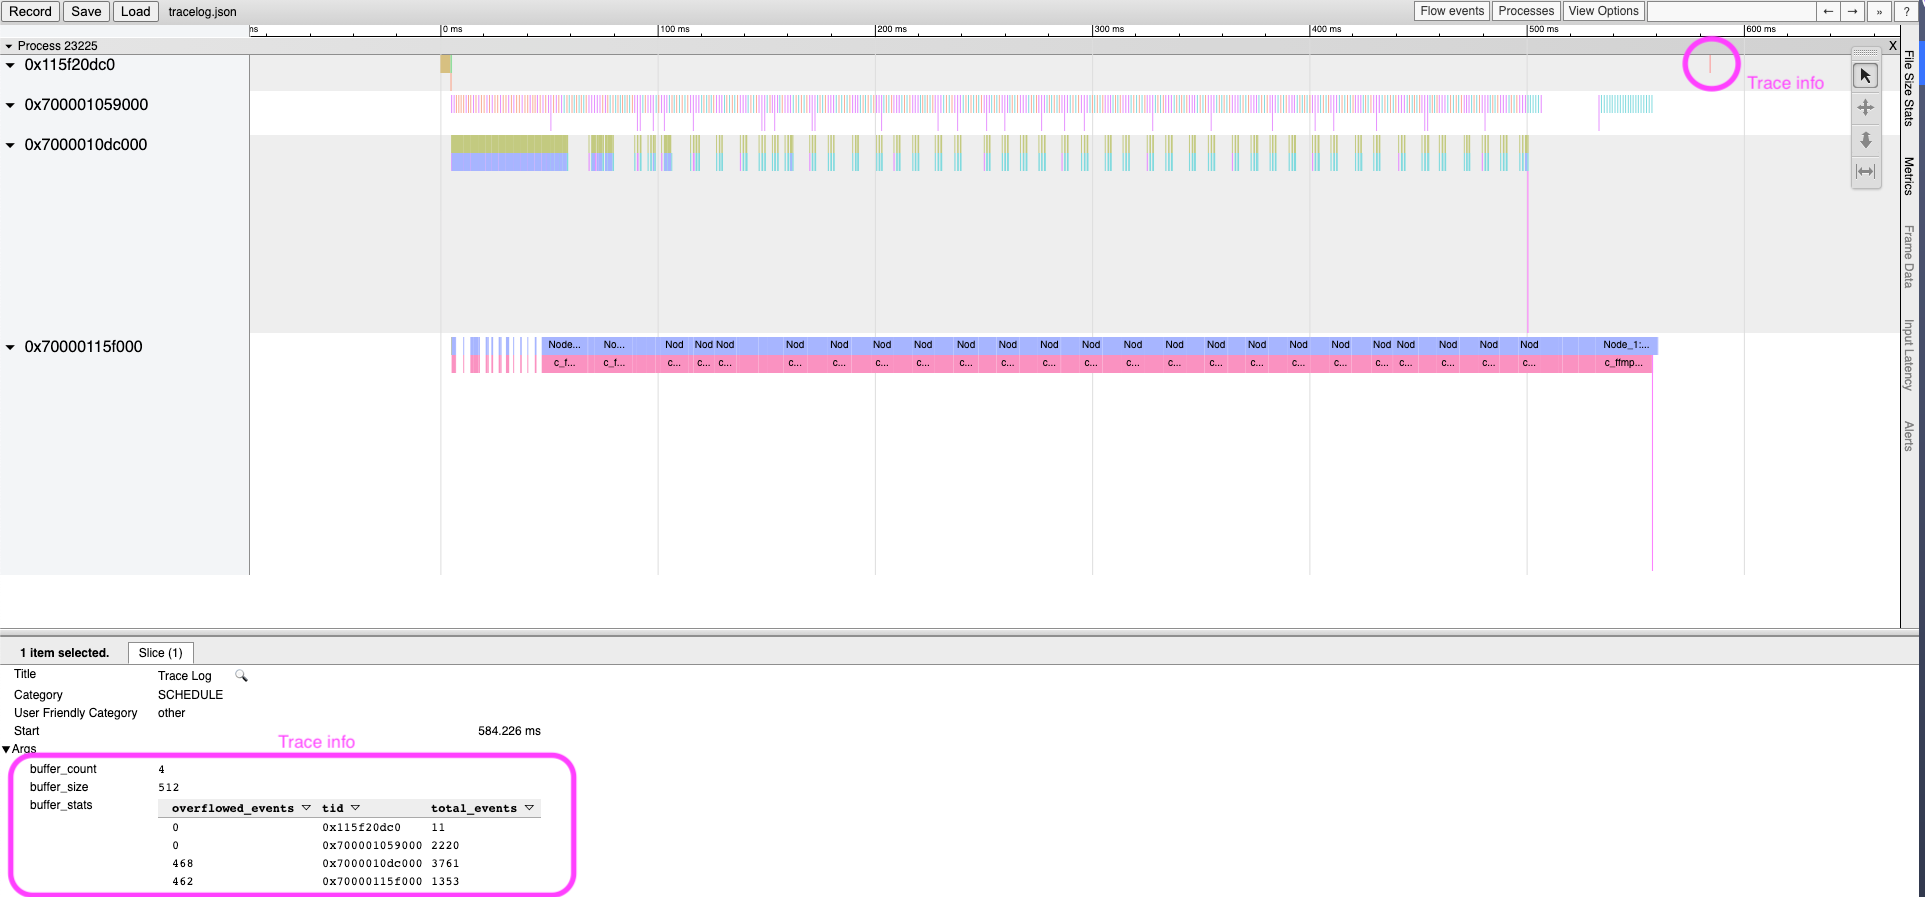
In the bottom panel you can see:
- Title: Trace event name
- Category: Trace type
- Start: Trace event occurrence time
- Wall Duration: Duration event execution time (instant event does not have this parameter)
- Args: Trace info or user info (additional parameters)
Note: If the overflow count is not 0, it means that the current buffer allocated is insufficient and some events are not logged (overflow). In order not to miss any trace events, it is recommended to increase the buffer size.
3. GraphUtilization tool
In addition to Chrome Tracing, BMF GraphUtilization Tool(not open source yet) also supports visualization of trace events:

The GraphUtilization tool can display graphs and some information or charts that Chrome Tracing can not display.
example
Example 1: Preload mode
As an example of using the Trace tool to identify bottlenecks in an implementation, consider a typical transcoding example:
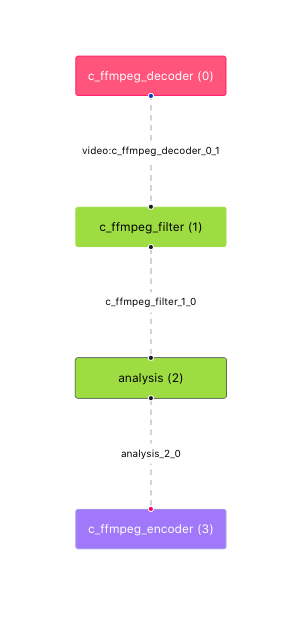
Note: The construction graph of the above graph can be displayed by GraphUtilization Tool
Use the following Python code:
module_name = "analysis"

(
     bmf. graph({"dump_graph": 1})
         .decode({'input_path': input_video_path})['video']
         .scale(320, 240)
         .module(module_name, {
             "name": "analysis_SR",
             "para": "analysis_SR"
         })
         .encode(None, {
         "output_path": output_path,
         "video_params": {
             "width": 300,
             "height": 200,
         }
     }).run()
)
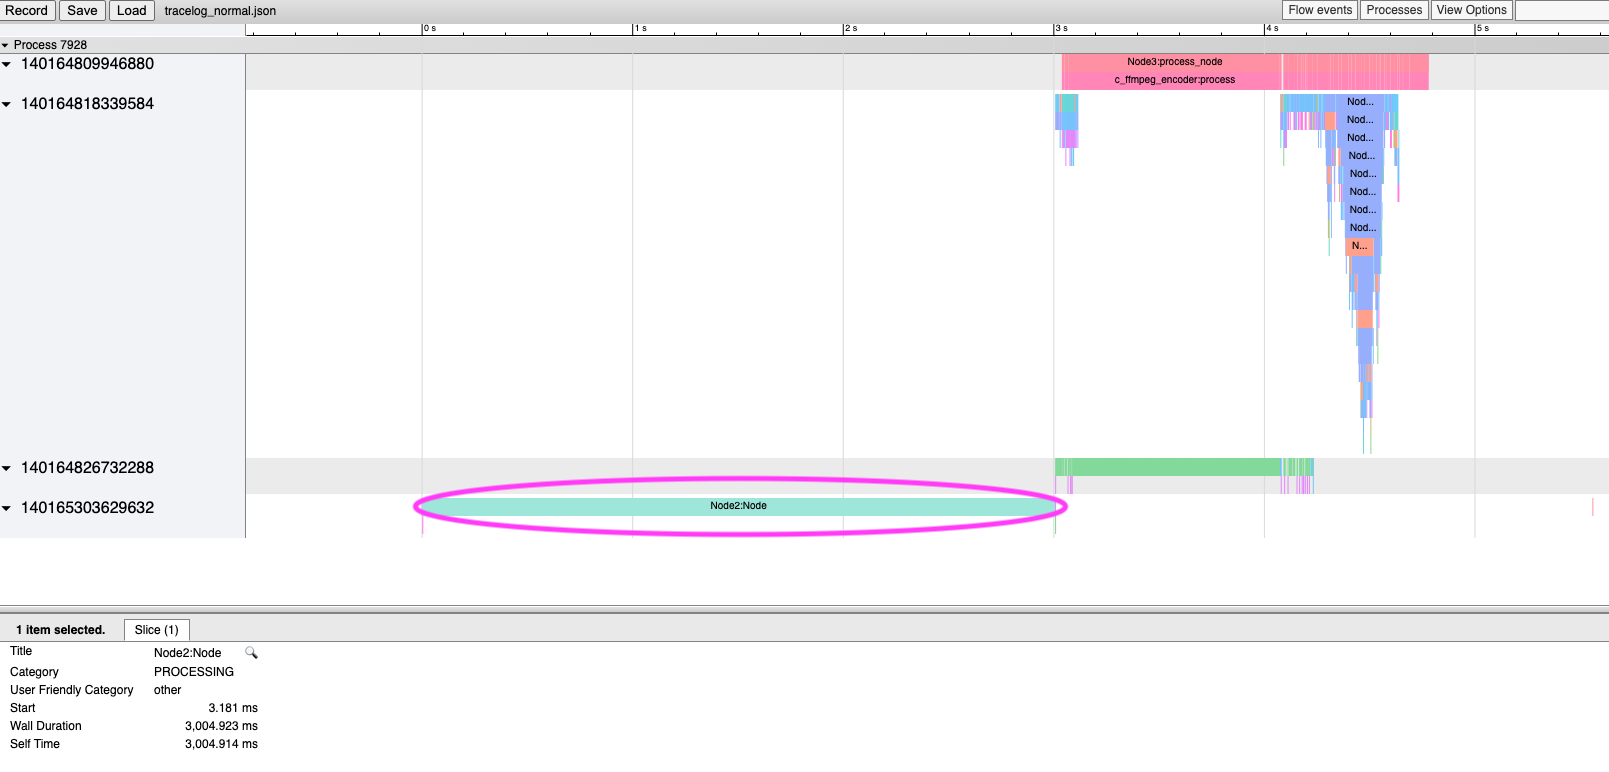
Executing this graph is time consuming if the pre-module method is not used. Using the tracelog generated by the Trace tool, it can be seen in Chrome Tracing that the initialization of Node 2 (that is, the analysis module in the above figure - the number in brackets indicates the Node ID) takes 3 seconds:
Optimized code using pre-module:
module_name = "analysis"

pre_module = bmf.create_module(module_name, {
     "name": "analysis_SR",
     "para": "analysis_SR"
})

(
     bmf. graph({"dump_graph": 1})
         .decode({'input_path': input_video_path})['video']
         .scale(320, 240)
         .module(module_name, option, pre_module=pre_module)
         .encode(None, {
         "output_path": output_path,
         "video_params": {
             "width": 300,
             "height": 200,
         }
     }).run()
)
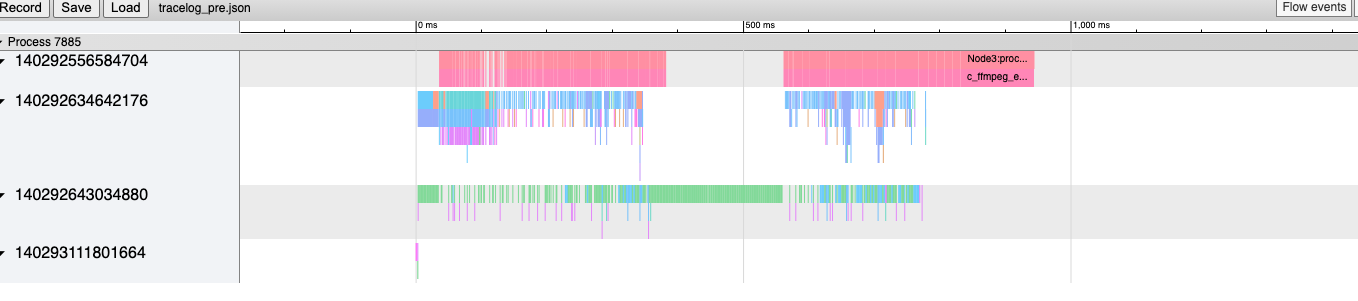
The pre-loading mode (pre-module) can significantly reduce graph execution time:
Example 2: Troubleshooting Hang problems
When writing modules, sometimes some bugs or bottlenecks are encountered, and the Trace tool can help users find the source of the problem.
The following example occurs in the encoder module, and the graph seems to hang when executing. Since the graph is not executed, the tracelog is not generated. However, after using trace_format_log, the tracelog will be constructed from and can be analyzed on Chrome Tracing:

The basic Trace node is limited, but it can be seen which node (and module) did not complete the process_node. If you need further analysis, you can add a CUSTOM Trace node (using the Trace interface) from the function, and you can further see the process call of the process function after re-running:
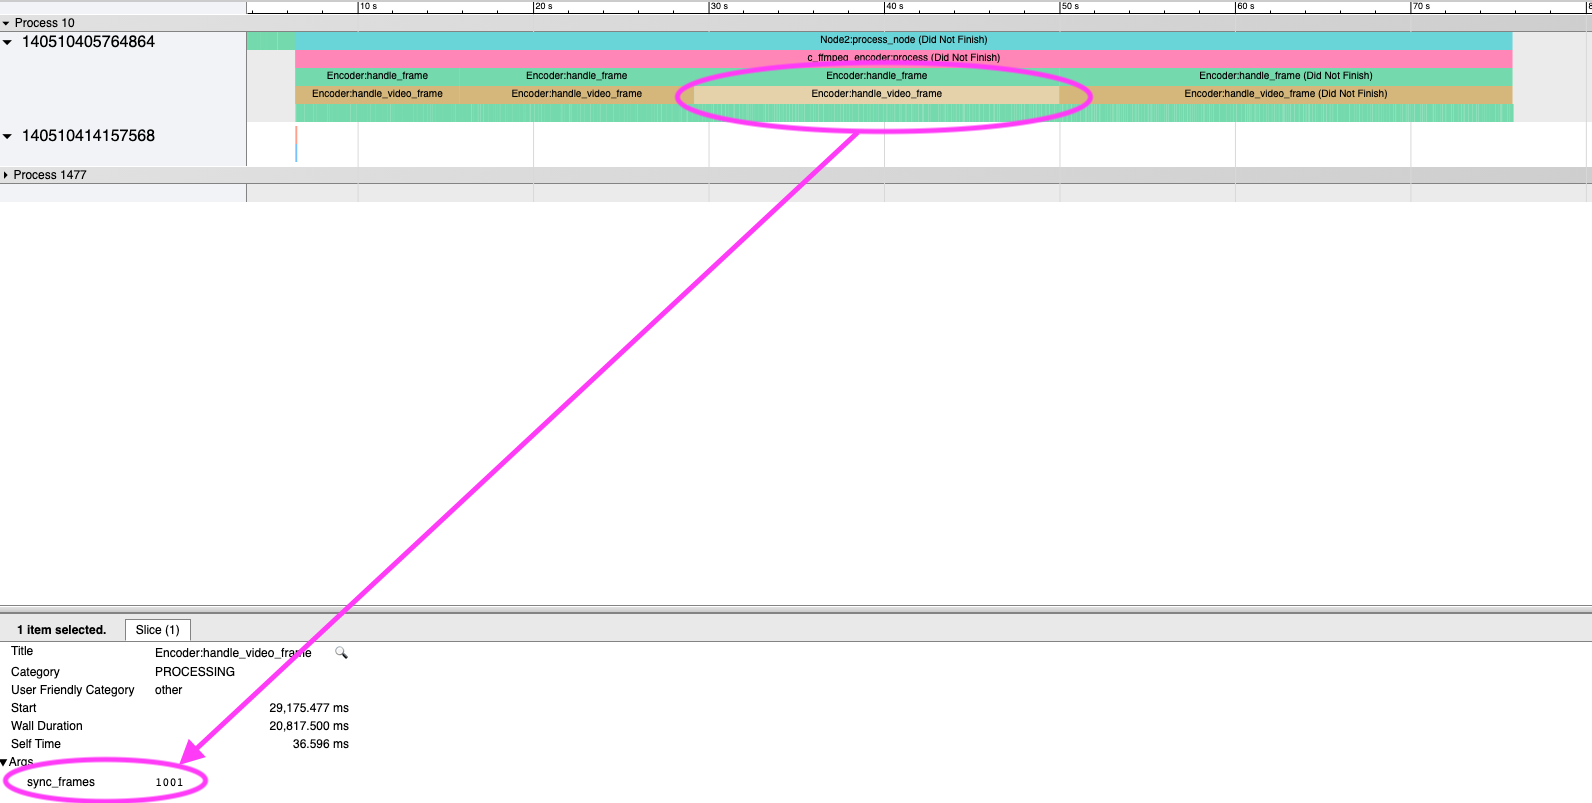
In this example, it can be seen that whenever there is a new video frame, the handle_video_frame function needs to process more than a thousand sync frames, resulting in a long execution time (it looks like hang).
Trace type
There are currently several Trace types available:
| Type Name | Description |
|---|---|
| PROCESSING | A duration event that captures nodes |